Each month, Buyers Meeting Point covers the release of the ISM Non-Manufacturing Report on Business. The report is released the first week of every month for the previous month. This month’s report can be found here.
If you have never read the report, it can take some adjustment. We are going to boil each report down to the basic and most useable components. I also recommend reading the ISM Report on Business Brochure.
If you only have 30 seconds, here is what you should know about this month’s report:
"The NMI registered 52.7 percent in July, 0.6 percentage point lower than the 53.3 percent registered in June, and indicating continued growth at a slower rate in the non-manufacturing sector. The Non-Manufacturing Business Activity Index increased 2.7 percentage points to 56.1 percent, reflecting growth for the 24th consecutive month and at a faster rate than in June. Respondents' comments remain mixed; however, for the most part they indicate that business conditions are flattening out."
WHAT RESPONDENTS ARE SAYING ...
- "Sales and customer traffic recovered slightly, pulling even with last year after trending lower for several months. Discretionary spending per customer has continued to decline in all areas of the operation." (Arts, Entertainment & Recreation)
- "Sales volumes are steady. Input costs are increasing." (Agriculture, Forestry, Fishing & Hunting)
- "Business outlook remains steady, but concerns about the second half of the year remain." (Professional, Scientific & Technical Services)
- "Municipal government has not bounced back at a similar pace to the private sector." (Public Administration)
- "New home construction is still very slow. Repair and remodel is the only bright spot." (Wholesale Trade)
- "Commodities cooling off and dropping a bit." (Retail Trade)
If you have 60 seconds, here is a little more:
Commodities Up in Price
Airfares (8); Asphalt Products; Beef; Can Liners (4); Cardboard; Cheese (2); Construction Labor; Copy Paper (2); Cotton Products (11); Dairy; #2 Diesel Fuel (13); Fuel (19); Gasoline* (10); Janitorial Maintenance Supplies; Lumber; Maintenance Contracts; Office and Computer Supplies; Packaging; Paper (9); Paper Products; Petroleum Products (7); Plastic Bags; Plastic Products (5); and Roofing Shingles.
Commodities Down in Price
Chicken; Computers and Computer Supplies; Diesel Fuel; Gasoline* (2); and Natural Gas.
Commodities in Short Supply
Trucks is the only commodity reported in short supply.
Note: The number of consecutive months the commodity is listed is indicated after each item.
*Reported as both up and down in price.
BMP Note: Keep in mind that the above listings include true commodities, or “any unprocessed or partially processed good, as grain, fruits, and vegetables, or precious metals” (Dictionary.com). While you may not be sourcing these exact items/categories, they may be present elsewhere in the supply chain – for example, used as raw materials or in the manufacturing processes used by your suppliers.
If you have 2 whole minutes to give:
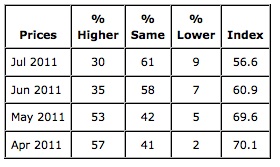 Prices paid by non-manufacturing organizations for purchased materials and services increased in July. ISM's Non-Manufacturing Prices Index for July registered 56.6 percent, 4.3 percentage points lower than the 60.9 percent reported in June. In July, the percentage of respondents reporting higher prices is 30 percent, the percentage indicating no change in prices paid is 61 percent, and 9 percent of the respondents reported lower prices.
Sixteen non-manufacturing industries reported an increase in prices paid, in the following order: Agriculture, Forestry, Fishing & Hunting; Arts, Entertainment & Recreation; Accommodation & Food Services; Retail Trade; Transportation & Warehousing; Real Estate, Rental & Leasing; Wholesale Trade; Educational Services; Utilities; Management of Companies & Support Services; Other Services; Health Care & Social Assistance; Mining; Finance & Insurance; Professional, Scientific & Technical Services; and Information. The two industries reporting a decrease in prices paid are: Construction and Public Administration.
Have 5 minutes? Take a look at the entire report and let us know what you think!
About the ISM "Report on Business":
There are two primary indices in the report:
- PMI: the Procurement Managers’ Index (manufacturing sector only)
- NMI: The Non Manufacturing Index
Both of the indexes are composite indexes, which means they are comprised of multiple indexes. All of the data for the report is qualitative, based on responses of ‘Better’, ‘Same’, or ‘Worse’ to a series of monthly questions by a confidential panel of procurement managers.
Each index is reported as a percentage. A percentage above 50% means that the outlook is generally positive, below 50% is generally negative. What matters more than the percentages themselves is the trend up or down over time.
While the index that attracts the most overall attention in the report is the PMI, procurement professionals may actually find the NMI to be more directly applicable to their open projects. The NMI covers the non-manufacturing sector of the economy: roughly 80% of GDP.