Chemical Industry – Snapshot at Pandemic
The Chemical industry has two unique characteristics. It has the most diversified end-use markets across all manufacturing industries, and its biggest customer is the Chemical industry itself (27%).
Size & Diversification
According to the European Chemical Industry Council (CEFIC) and the American Chemistry Council (ACC), the total global Chemical market in 2019 was US$4,164 B, as shown in Graph I below.
Graph I
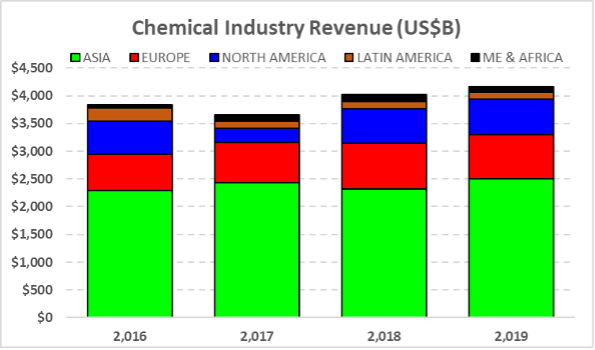
Based on the data from CEFIC, ACC, and Accenture, I have created a snapshot of the end-use market in the USA for 2019, shown in Graph II below. As there is no global data by end-use market, I am using the USA as a reference to show the diversification of end-use markets.
Graph II
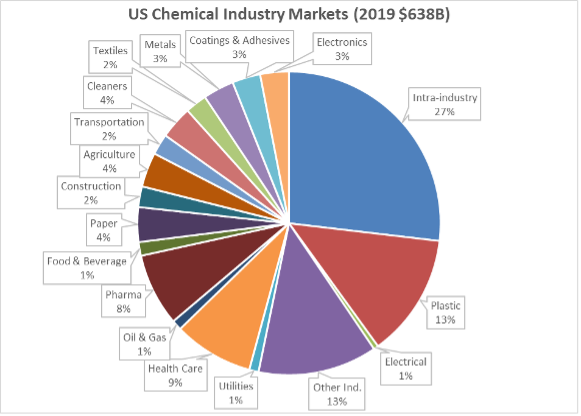
I believe there is no other manufacturing industry that is serving so many different industries. There are 16 specific end-use markets (industries), plus Intra-industry (or Chemical) (27%), and Other Industries (13%) not specifically described.
Resilient
According to Merriam-Webster, “resilient” means tending to recover from or adjust easily to misfortune or change. There is no doubt that 2019 and 2020 brought huge changes across all industries due to the global pandemic. Because there is not much data available to translate the impact on the industry, I have compared global exports of Chemicals & Plastics (C&P) to global GDP growth, as shown in Graph III below. Just as a reminder, exports are part of the GDP of any country.
The blue bars show global exports (in billions of dollars) of Chemicals & Plastics while the red arrow shows GDP growth (in percentages).
Graph III
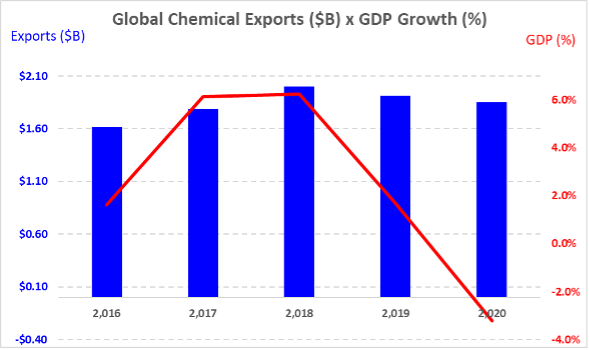
Most striking is that global markets had low global GDP growth in 2019 (1.7%) and negative growth in 2020 (-3.2%). Even so, global C&P exports, which are used by almost all manufacturing industries, did not decline in the same proportion, which means the Chemical industry is resilient.
Graph IV shows the export changes for several industries from 2019 to 2020, showing the resilience of each industry in regard to the pandemic.
Graph IV
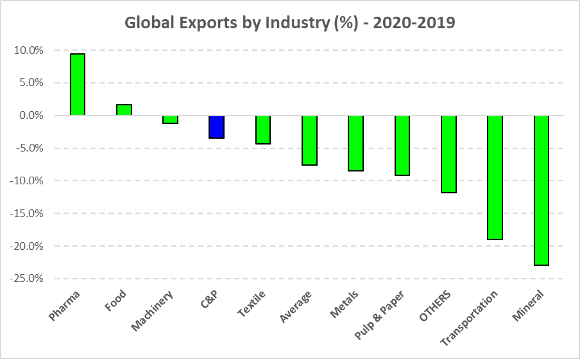
We know that the global GDP growth from 2019 to 2020 was -3.2%, whereas the global exports average was -7.6%. Compared to the global average, then, the Chemical industry showed remarkable resilience. Pharmaceuticals grew 9.5% during this period, understandably, as people needed additional medicines during the pandemic. Food also grew slightly (1.7%) because people need to eat no matter what the global situation is. Machinery had only a small decrease (-1.2%), probably because CAPEX is a medium-term effect.
Again, the relatively small C&P decrease (-3.4%) was lower than the global average, which probably is justified by a diversified end-use market.
Market Outlook
During 2020, the C&P demand decreased because of the pandemic. At the end of 2020, all industries had decreased their inventories to show good numbers on their balance sheets. In January 2021, we witnessed snow and massive freezes in Texas and Louisiana, where several C&P plants shut down for two weeks. During that period, the demand recovered much more than expected, so without inventory and plants taking time to recover, there were price spikes all over.
The International Monetary Fund (IMF) has forecast that global GDP will grow 11% in 2021 to recover from the last two years. While I forecast a strong recovery, I do not expect the Chemical industry to grow to that extent. Tempering our faith in resilience, we need to view growth through the lens of the 2016–2017 rate. With this understanding, I foresee a more moderate recovery of 5.5%.
All purchasing personnel must be aware that with high growth we may expect price increases. However, since we have already had price increases in 2021, I expect the price to be at same level of 2020.
When you subscribe to the blog, we will send you an e-mail when there are new updates on the site so you wouldn't miss them.
